TechnoKids TechnoCandy


Description
Spreadsheet Lessons for Elementary Grades
Spark student interest with fun and engaging spreadsheet lessons and word processing activities for beginners. In TechnoCandy, students embark on a real-world mission to enhance candy sales. They investigate the problem by conducting a survey and researching candy packaging. They use a spreadsheet to organize, calculate, and graph data. Then they develop a plan to boost sales by adjusting candy colors. Based on the evidence, students recommend a solution in a written report. This project seamlessly teaches spreadsheet skills in one meaningful, integrated project.
Authentic Spreadsheet Lessons for Kids Ages 8-11
Students build technology skills with a real-world task: reviving declining sales at a candy company. The inquiry-based approach captivates children, turning the project into a motivating learning opportunity.
Empower Learning through Active Engagement
Hook student interest and reinforce curriculum objectives with active learning. As students research the problem using a survey and then design a solution, they build problem solving strategies, grow their critical thinking skills, and develop creativity. Teach inquiry and analytic research methods by challenging students to solve a business problem. Develop confident risk-takers. Through decision-making simulations, students build essential personal skills like perseverance, self-management, initiative, and responsibility. TechnoCandy prepares students for the future by cultivating personal and social skills in addition to academics.
Easy-to-Follow Instructions
Resources include a comprehensive Teacher Guide with illustrated, step-by-step instructions to ensure easy navigation. Additional resources provided are assessment tools, optional extension activities, templates, and sample completed spreadsheets and reports. A fun Bingo game is included to make learning cell references enjoyable. Course includes age-appropriate lessons for students to learn either Google Sheets or Excel spreadsheet skills.
Integrate STEM into Lesson Plans
Create a blended learning environment. Combine technology with math though activities that focus on organizing, problem-solving, graphing, calculating, and sorting data. Connect mathematics to everyday challenges. Students make decisions based on real world data that they collected, making spreadsheets relevant.
TechnoKids TechnoCandy
- Publisher: TechnoKids
- Grade Level: 3-6
- Platform: Win
- Item #: JNR-CANDY
We will honor all current TechnoKids promotions!
| Starter account. Includes online teacher 12mths #JNR-CANDY |
Price: $49.00 | |
| Class account: Teacher plus up 40 students 12mths #JNR-CANDYC |
Price: $109.00 |
Features and Benefits
Assignment 1 Spreadsheets and You
Recognize the practical application of spreadsheets. Set a goal for learning.
Assignment 2 Explore Spreadsheets
Learn spreadsheet terminology and acquire basic skills.
Assignment 3 Understand the Problem
Grasp the challenge facing the candy business. Formulate a plan to collect information.
Assignment 4 Conduct a Survey
Administer a survey about color preferences to research the problem.
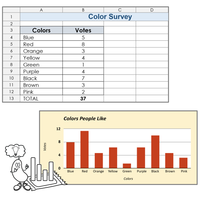
Assignment 5 Record Survey Results in a Spreadsheet
Organize survey results in a spreadsheet. Format the data to make it easy to read.
Assignment 6 Calculate Survey Data
Compute totals using the Sum function.
Assignment 7 Graph the Survey Results
Represent data in a column chart. Customize the chart style. Interpret the survey results.
Assignment 8 Research the Candy
Investigate candy packaging. List predictions and actual amounts of colored candies.
Assignment 9 Record Research Results
Organize data in a new worksheet. Calculate totals using the Sum function.
Assignment 10 Make a Comparison Chart
Sort data. Create a double bar graph. Edit the title, legend, and axes. Analyze research findings.
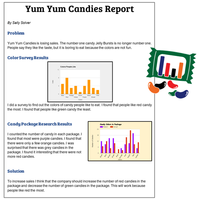
Assignment 11 Report Solution to the Problem
Recommend a proposal based on the evidence. Support reasoning using graphs.
Assignment 12 Submit the Report
Verify the report is complete using a checklist. Revise the content. Print or share the document.
Videos

System Requirements
| Ages | 8, 9, 10, 11 |
|---|---|
| Grades | grade 3, grade 4, grade 5, grade 6 |
| Program | Excel, Forms, Sheets, Docs, Slides, PowerPoint, Word |
| Tech Integration | business studies, language arts, math, visual arts |
| Tech Skill | data analysis, graphics, spreadsheet, word processing |
| License | Homeschooling, Starter, Class, Classrooms, School |
| Starter License Includes | online teacher guide, online student workbook, get started, course slides, printable assessment tools, sample files, templates, extension activities, certificates, parent letters |
| Class License Includes | online teacher guide, getting started tips, course calendar, online student workbook, online assignments, printable assessment tools, online quizzes, student reporting, sample files, extension activities, certificates, parent letters, templates |
| Classroom License Includes | online teacher guide, getting started tips, course calendar, class management tools, online student workbook, online assignments, printable assessment tools, online quizzes, student reporting, sample files, extension activities, certificates, parent letters, templates |
| Product Type | Course |
| Homeschool License Includes | Certificates, Extension activities, Online assignments, Online quizzes, Online teacher guide, Parent letters, Remove printable assessment tools, Sample files, Student reporting, Templates |